Studying real time human mobility triggered by social events through on-line networks
Studying real time human mobility triggered by social events through
on-line networks
The Via Catalana could be traced on a map by using Twitter data, according to IFISC (UIB-CSIC) reseachers
Antònia Tugores, Jose Ramasco and Pere Colet, researchers from IFISC, use Twitter data to show the impact of social events on human mobility.
A team of researchers on social networks analysis from the “Institute for Cross-disciplinary Physics and Complex Systems” IFISC have studied how the “Via Catalana” can be depicted using geolocated tweets. “Via Catalana” was a human chain scheduled for yesteraday, September 11, the Day of Catalonia.
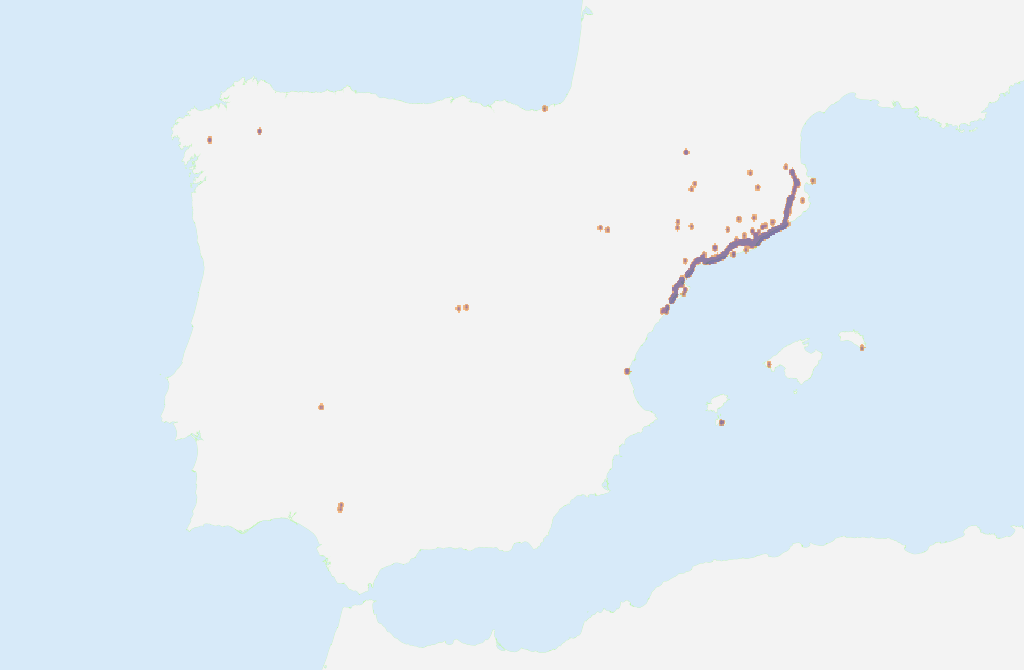
Researchers downloaded tweets mentioning “viacatalana” or including the hashtag #viacatalana, totaling about 175.000. They then selected those tweets that were geolocated, about 1000 for each two-hour period, and plotted the results on a map. It is important to remark that the data is unbiased and no processing was done prior to plotting.
Analysis of urban mobility is one of the active research lines at IFISC, which entails the study of data from on-line social networks. Some users had enabled the option that includes geolocated information as part of their tweets. Thils allows researchers to determine the user location at the posting time, and potentially to track their movements.
There was a call for a demonstation yesterday in the center of Barcelona and for a human chain crossing Catalonia from North to South along the Mediterranean coast. By comparing this data with the one from an ordinary day it is possible to study how social events change people's mobility.
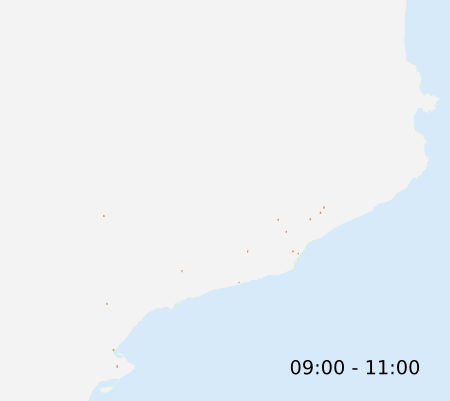
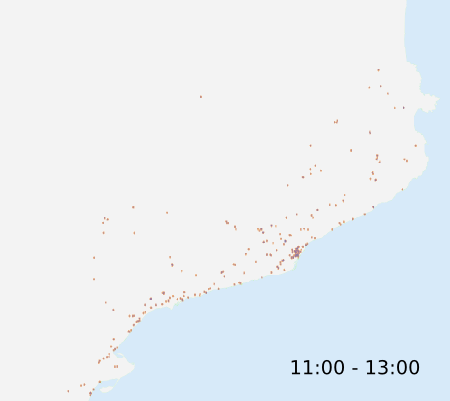
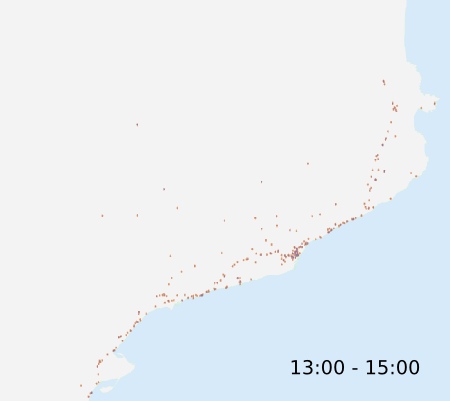
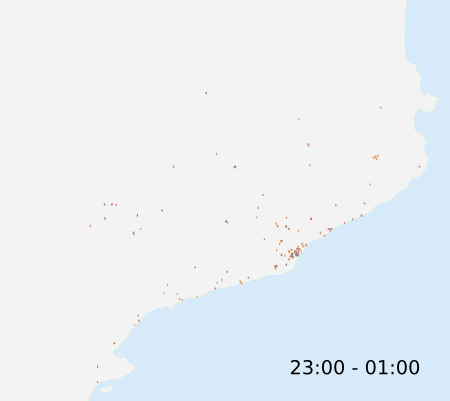
This slider shows the time evolution of geolocated tweets from 9:00 in the morning until night of the Via Catalana event.
The first map shows tweets mentioning viacatalana or with the hastag #viacatalana collected on September 11, 2013 in the Barcelona metropolitan area between 17:00 and 19:00 local time.
For comparison we show the twitter activity geolocated in the metropolitan area of Barcelona in an ordinary day between 17:00 and 19:00

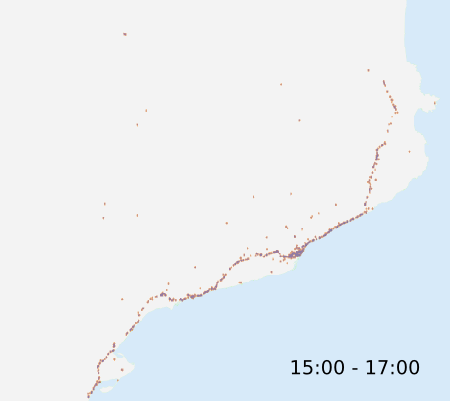
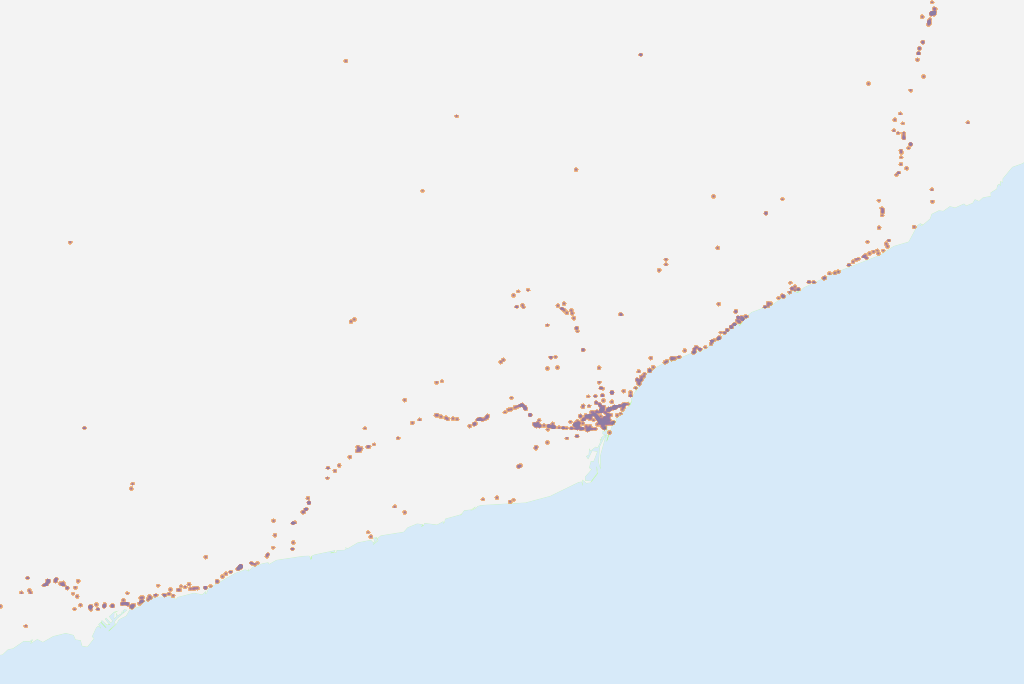
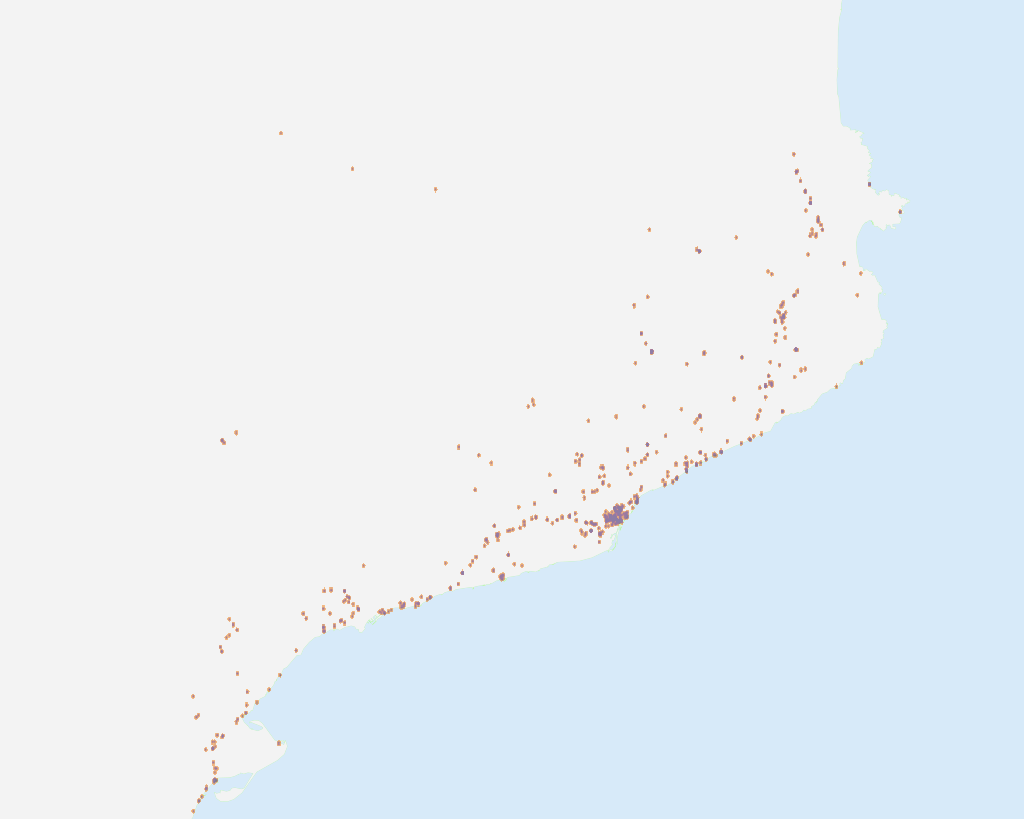
This map shows tweets with the same characteristics as the first map but collected across the entire Catalonia between 15:00 and 17:00
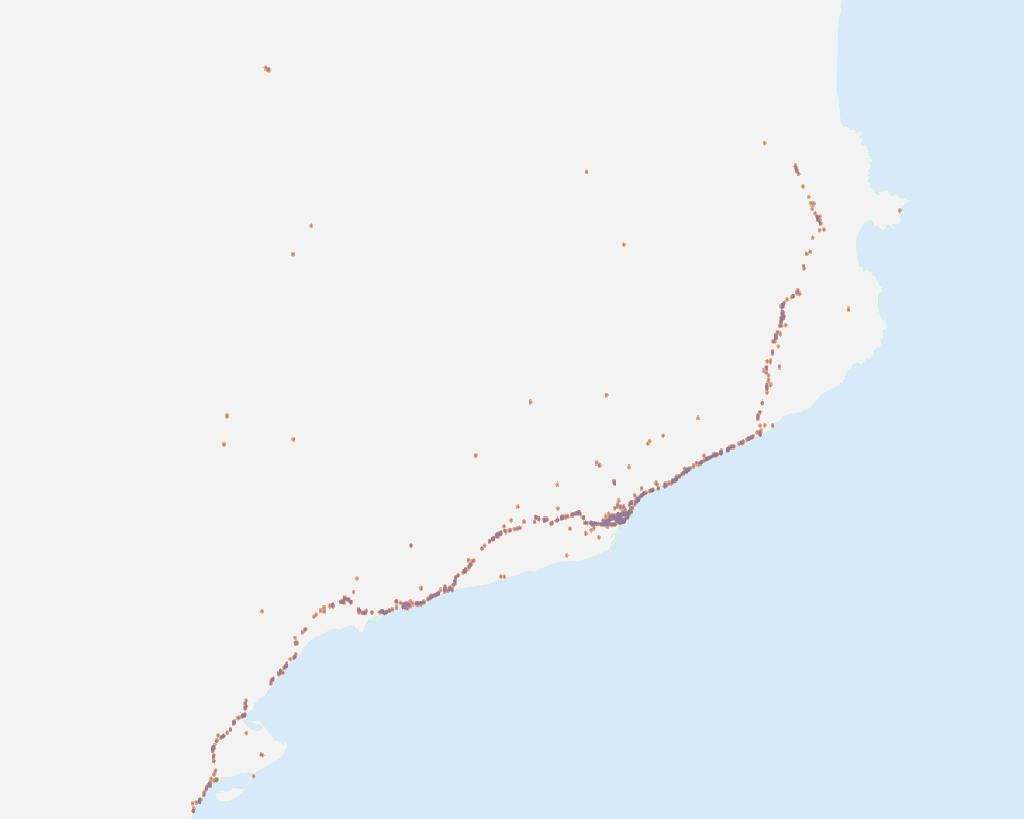
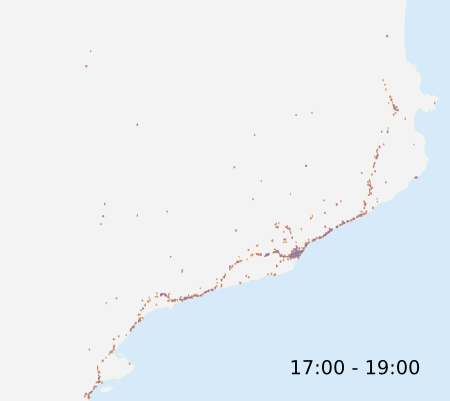
This map shows tweets with the same characteristics as the first map but collected across the entire Catalonia between 17:00 and 19:00
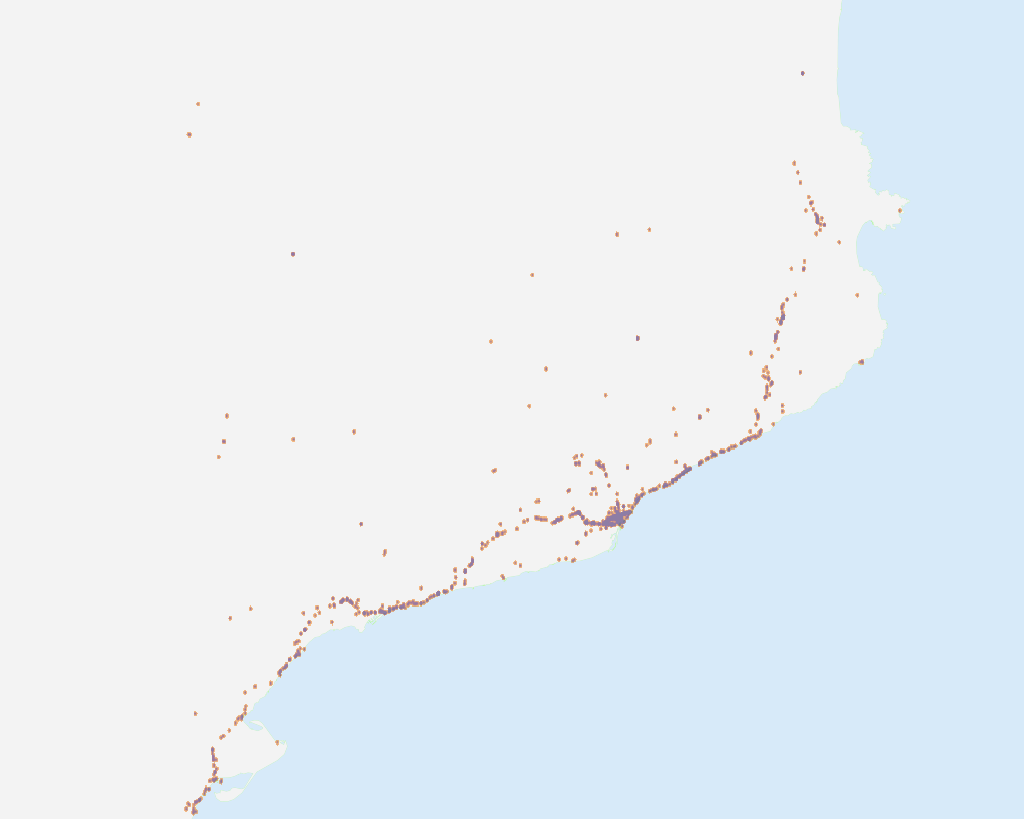
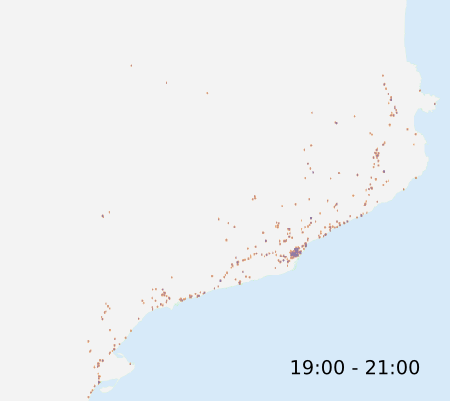
This map shows tweets with the same characteristics as the first map but collected across the entire Catalonia between 19:00 and 21:00 when the participants starts to disperse.
This map shows tweets with the same characteristics as the first map but collected across the entire Spain between 15:00 and 17:00